AC/DC Calc
rectifier basics · component behavior
Bridge rectifier diode losses: what a two-drop estimate means
Understand the useful 2Vf voltage model and why it does not replace current-waveform or thermal analysis.
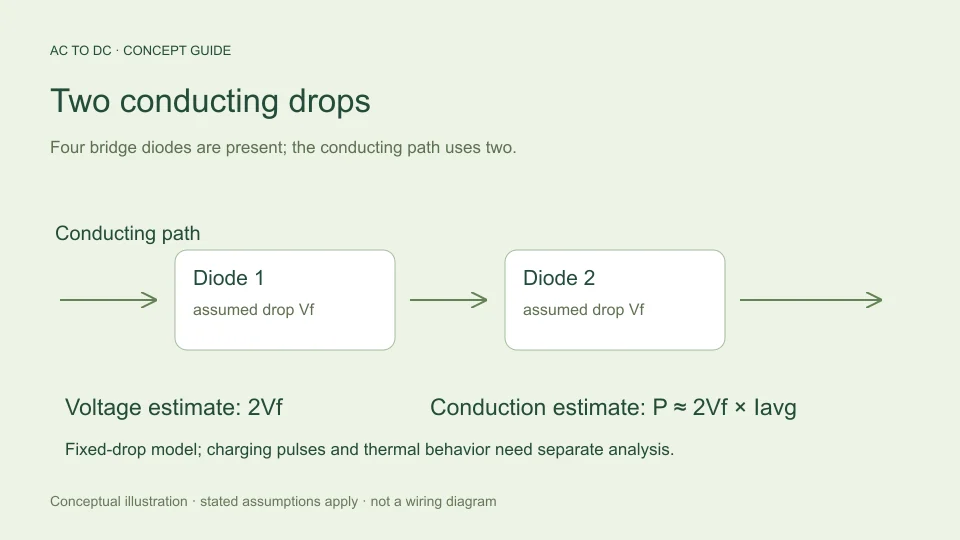
A bridge rectifier does not deliver the full ideal sine peak to its output. During a conducting interval, current follows a path through two forward-biased diodes. A simple model assigns each diode a fixed forward voltage Vf, producing a combined path drop of 2Vf.
That model is useful for a first estimate of available voltage. It becomes misleading when its convenient fixed number is treated as a complete account of efficiency, charging-current stress, or component temperature. The same bridge can be described in terms of average output current, instantaneous diode current, RMS current, and power dissipation. These quantities answer different questions and should stay separate throughout a calculation.
Start with the conducting path
During one AC half-cycle, one pair of bridge diodes carries output current. During the other half-cycle, the other pair conducts while maintaining the same output polarity. Four diodes are present in the bridge, but the instantaneous forward path contains two, not all four.
If the model assumes 0.7 V per diode, the path drop is 1.4 V. Subtracting 2.8 V merely because four diodes appear in the circuit would count components that are not simultaneously in the conducting path. Conversely, subtracting only 0.7 V would omit one conducting junction.
The number 0.7 V is an illustrative assumption here. It is not a promised forward voltage for every silicon rectifier, at every current and temperature. The diode forward-voltage guide explains why a real device requires condition-specific data.
Apply the drop to the correct voltage quantity
For sinusoidal input, the ideal crest is √2 × Vrms. In the site’s capacitor-filtered bridge model, the available top is approximately √2 × Vrms − 2Vf, with negative results limited to zero. This estimates the level toward which the reservoir capacitor can recharge under the simplified assumptions.
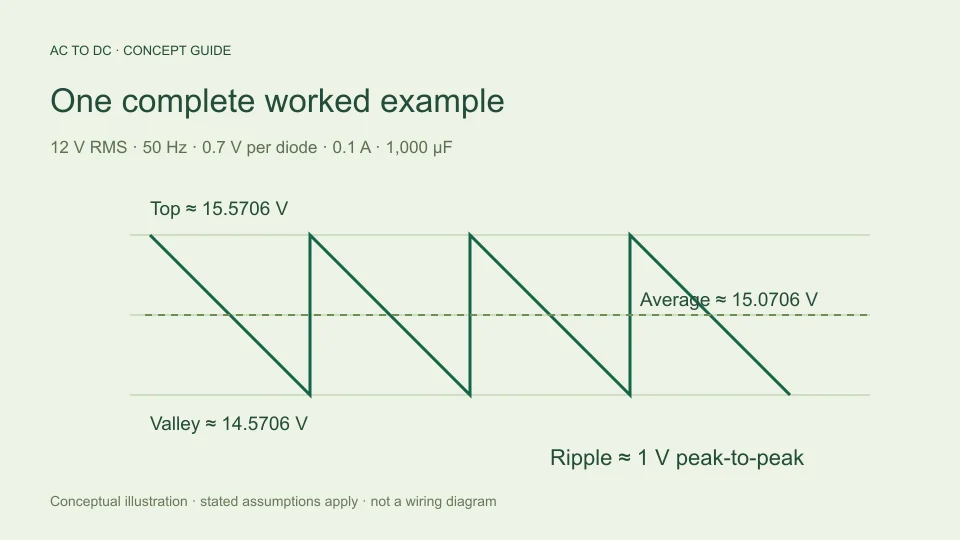
At 12 V RMS, the sine crest is about 16.9706 V. Subtracting a 1.4 V conducting-path drop gives about 15.5706 V. The capacitor’s estimated average then depends on discharge ripple; it is not necessarily equal to that top voltage.
Do not subtract a fixed drop from an unrelated average and call the result an exact diode-corrected waveform integral. Near zero crossings, real diodes stop conducting instead of producing negative load voltage. The site’s ideal unfiltered modes deliberately assume zero diode loss so their analytical averages have a clearly defined scope.
Distinguish voltage loss from power loss
Voltage drop is measured in volts. Power dissipation is measured in watts and depends on both current and voltage. At an instant when the path carries current i, a fixed-drop bridge model gives conduction power p ≈ 2Vf × i.
If the fixed-drop approximation remains applicable throughout the relevant current waveform, averaging gives P ≈ 2Vf × Ipath,average. Under steady-state charge balance, the average bridge output current supplies the load’s average current, ignoring leakage and other losses. This motivates the familiar rough expression Pbridge ≈ 2Vf × Iload.
The expression is an average conduction estimate within a fixed-voltage model. It does not say that instantaneous current equals load current. It also does not account for a current-dependent forward characteristic, dynamic effects, or a device’s thermal path. Naming these assumptions is part of using the formula correctly.
Work through an illustrative conduction estimate
Assume a hypothetical 0.1 A steady average load and fixed 0.7 V drop per conducting diode. The two-drop estimate is Pbridge ≈ 2 × 0.7 × 0.1 = 0.14 W. At 0.5 A under the same deliberately fixed-drop assumption, it becomes 0.7 W.
These arithmetic examples explain how the model scales. They are not measured results for a named bridge and do not justify extrapolating the same forward voltage to a different current. A real comparison should use an appropriate forward characteristic or a device model at the intended operating conditions.
The output-power calculation is different again. If an estimated average output were 15 V at 0.1 A, its approximate load power would be 1.5 W for a constant-current load at that nearly steady voltage. Comparing that value with 0.14 W does not yield a complete supply efficiency because the transformer, capacitor, and other losses remain outside this partial calculation.
Why capacitor charging produces pulses
A reservoir capacitor can continue supplying the load when the rectified source voltage has fallen below the stored capacitor voltage. The bridge then does not carry the load current continuously. It carries current during intervals when the source can recharge the capacitor and support the load.
The charge removed between recharging intervals has to be replaced. If the same quantity of charge is transferred over a shorter conducting interval, the average current during that interval is greater than the average current over the entire cycle. This follows from charge divided by time, without needing to assume a particular pulse shape.
For example, transferring 0.001 coulomb over a hypothetical 1 millisecond interval implies 1 A averaged over that interval. Spread over 10 milliseconds, the same charge corresponds to 0.1 A. This is a timing illustration, not a prediction of an actual bridge’s conduction angle or peak current.
Average current is not RMS or surge current
Two waveforms can carry the same average charge per cycle but have different RMS currents. A narrow high pulse contributes more strongly to mean squared current than a broad low pulse with equal total charge. Resistive heating is therefore not determined by average current alone.
Startup creates another operating condition because an initially discharged capacitor does not begin at its steady-state voltage. An ordinary steady-state ripple equation does not model that event. A non-repetitive surge rating, a repetitive operating limit, and an average rectified-current rating cannot be exchanged as though they describe the same test.
A real manufacturer’s data sheet makes these distinctions explicit. For example, Vishay’s KBPE0480 data sheet lists separate electrical and surge-related ratings with stated conditions. This guide does not select that device or import its ratings into the calculator; it uses the document to show why a single current number is insufficient.
Use forward-voltage data under relevant conditions
A forward characteristic relates instantaneous current and forward voltage. If voltage changes throughout a current pulse, a more representative average conduction calculation integrates the product v(t)i(t) over the cycle. Replacing that product with one constant drop multiplied by average current is an approximation that should be labeled accordingly.
The Toshiba explanation of rectifier forward characteristics notes dependence on current and temperature. This is why a catalog headline or a familiar rule of thumb is not a universal operating value.
For an analytical comparison, you may deliberately hold Vf fixed while varying another parameter. That is a useful sensitivity exercise because it isolates one cause. It should not be presented as evidence that a real diode’s voltage remains unchanged across the same operating range.
Keep the thermal question separate
Watts of estimated loss do not directly establish junction temperature. Temperature depends on how heat leaves the junction through the package and surrounding structure, as well as the operating environment and time history. A calculator that only accepts input RMS voltage, frequency, load current, capacitance, and diode drop has not been given enough information to answer that question.
Likewise, a current rating from a data sheet belongs to its stated conditions. It cannot safely be treated as an unconditional current capacity for every mounting arrangement. The educational purpose of the two-drop model is to explain voltage and a rough conduction contribution, not to certify thermal suitability.
When documenting a result, use separate lines for assumed forward voltage, estimated average conduction power, and the still-unverified thermal and current-waveform questions. This prevents a neat numerical answer from hiding missing information.
Read the calculator result as a partial model
The AC to DC calculator uses two diode drops to estimate the filtered bridge’s available top voltage. It then uses charge balance for ripple and a midpoint approximation for average DC. It does not output bridge power dissipation, peak charging current, or component temperature.
Changing the per-diode drop changes available peak, valley, and average while the simple ripple equation remains tied to current, frequency, and capacitance. That behavior is intentional and follows the selected model. It does not mean diode characteristics have no influence on a real charging waveform.
For a reproducible estimate, record which quantity was calculated and which assumptions were fixed. “Two assumed 0.7 V diode drops” is clear. “The bridge always loses 1.4 V” is too broad. That small change in wording keeps a practical rule of thumb connected to the conditions that give it meaning.
Compare two assumptions without claiming a device improvement
Suppose a model is evaluated first with 0.7 V per diode and then with a hypothetical 0.5 V per diode, while every other input remains fixed. The available top increases by 0.4 V because two conducting drops have each decreased by 0.2 V. The same simplified ripple remains, so estimated average and valley also increase by 0.4 V.
This is a clean mathematical sensitivity test. It does not establish that changing to an unspecified diode technology will produce that improvement in the real circuit. Different devices can change the charging interval, current waveform, leakage, and other properties omitted by the fixed-drop calculation. A meaningful product comparison requires actual operating data for both devices.
The distinction is useful whenever a calculator offers an adjustable diode-drop field. The control lets you examine an assumption, rather than select a component automatically. Labeling hypothetical comparisons honestly makes the tool helpful for understanding dependencies while leaving device qualification to the evidence and analysis it requires.
Filed under rectifier basics component behavior