AC/DC Calc
power supply concepts · rectifier basics
Unregulated vs regulated DC supplies: where the rectifier model ends
Understand why a rectifier estimate is not a prediction of an adapter or regulated output.
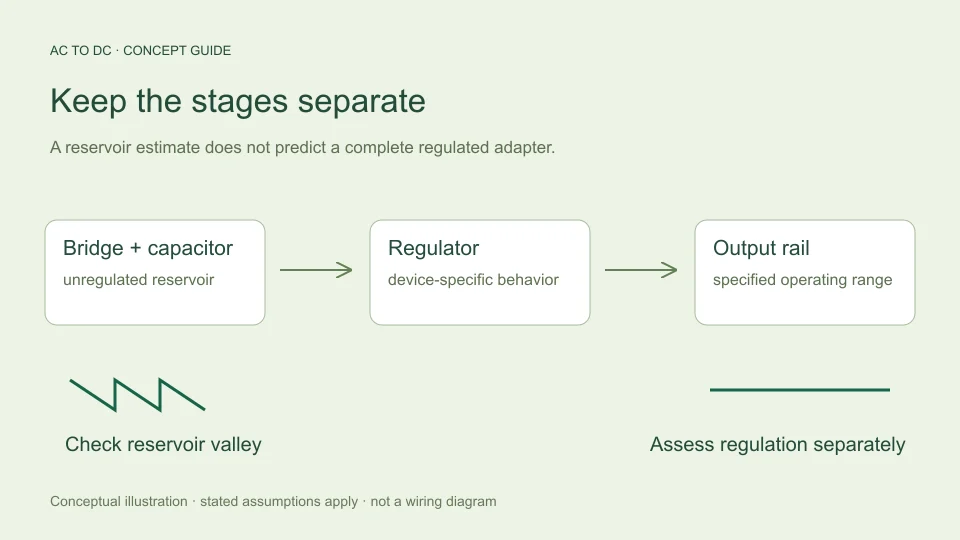
An AC to DC rectifier estimate describes selected behavior of a defined rectifier circuit. It does not automatically predict the output printed on an AC adapter. A regulated supply contains additional circuitry intended to control its output, so the relationship between its input and output is different from the simple bridge-and-capacitor model.
The most useful distinction is the location of the quantity being discussed. A reservoir capacitor may carry an unregulated voltage with repeating ripple. A downstream regulator may produce a different nominal level and a different ripple waveform. Both can exist in the same supply, but their voltages should not be given the same label. This guide separates the stages and explains the information needed to compare them.
Rectification and regulation do different jobs
Rectification directs current so an alternating input can produce an output of one polarity. Filtering stores and releases energy to change the waveform between rectified crests. Regulation adds a control function intended to maintain an output within its operating conditions.
These functions can be arranged in different ways. A simple educational diagram might show transformer, bridge, reservoir capacitor, regulator, and load. An actual switch-mode adapter can have a more involved architecture. The fact that both accept AC and deliver DC does not mean that one arithmetic multiplier describes both.
The AC to DC calculator concerns selected rectifier models. Its filtered mode estimates the reservoir voltage before a regulator. It does not contain a regulator control model or a switch-mode conversion model, and its result should not be relabeled as the guaranteed output of either.
Understand an unregulated reservoir voltage
In the simplified capacitor-filtered bridge model, the capacitor recharges toward the sine peak minus two fixed diode drops. A load then removes charge between charging opportunities. With approximately constant current and linear discharge, ripple is estimated from I/(2fC).
At 12 V sinusoidal RMS, 50 Hz, 0.1 A, 1,000 µF, and 0.7 V per conducting diode, the available top is about 15.5706 V. Estimated peak-to-peak ripple is 1 V, giving a valley of 14.5706 V and a midpoint average of 15.0706 V.
These numbers refer to the modeled reservoir node. They are not a promise that a nominally “12 V” adapter will produce 15.0706 V, because an adapter’s label, regulation circuitry, source impedance, load conditions, and operating specifications must be understood separately.
Average voltage does not describe the lowest input
The midpoint average is useful for summarizing a small approximately linear ripple, but it hides the minimum level during the cycle. A downstream circuit can behave differently at the valley than it does at the average.
For the example above, a statement that the reservoir is “about 15.1 V DC” leaves out the estimated fall to 14.5706 V. If the next stage needs headroom above its desired output, the valley becomes an important part of the analysis. The average alone cannot show whether headroom is maintained throughout the cycle.
The same reasoning applies to any waveform description: peak, average, RMS, and minimum are not interchangeable. A useful report states which quantity is being quoted and preserves the other values needed for the intended interpretation. See RMS, peak, and average voltage for the waveform definitions.
A linear regulator needs operating headroom
Dropout describes the minimum input-to-output voltage difference needed for a linear regulator to maintain its specified regulating behavior under stated conditions. TI’s LDO dropout explanation discusses this distinction and the behavior when the input falls below the required level.
For a hypothetical illustration, suppose a downstream stage required its input to remain 0.5 V above a desired 12 V output. The minimum input condition would then be 12.5 V under that deliberately assumed requirement. Comparing that value with a modeled reservoir valley is more relevant than comparing it only with the average.
The 0.5 V number here is not assigned to any particular regulator. Actual dropout depends on the selected device and operating conditions. A rectifier calculator cannot determine it from AC voltage, and passing one headroom comparison does not establish full regulator suitability.
Regulation is not the same as perfect ripple removal
A regulated output can still contain ripple and noise. Power supply rejection ratio, or PSRR, describes how an input disturbance is attenuated to the output under specified conditions. It is not a universal promise that all input ripple disappears.
TI’s discussion of power-supply ripple rejection explains PSRR as a frequency-dependent input-to-output ripple relationship. This means a value quoted at one frequency and operating condition should not automatically be applied to every other case.
For a purely mathematical example, 40 dB of voltage-ripple rejection corresponds to an amplitude ratio of 100 because 20 log₁₀(100) = 40. If that rejection genuinely applied to a particular 1 V input-ripple component, the corresponding output component would be 0.01 V. The conditions and spectral content would still need justification before using that example for an actual regulator.
Separate ripple rejection from generated noise
Input ripple passing through a regulator is not the only possible output disturbance. A regulator can also contribute noise of its own, and a load can introduce changes that the control system responds to over time.
Analog Devices’ AN-1120 distinguishes intrinsic and extrinsic noise sources in LDO regulators. That distinction is useful when reading measurements: an output-noise specification and a PSRR curve describe different aspects of behavior.
Consequently, multiplying one reservoir-ripple number by a rejection factor does not calculate every component of total output noise. A meaningful comparison needs a measurement bandwidth, relevant frequencies, input conditions, load conditions, and a clear definition of what is being measured. A single DC average cannot supply that information.
A switch-mode supply requires its own model
A switch-mode regulator controls energy transfer using switching action and associated circuitry. Its output is not generally found by subtracting a fixed voltage from a bridge’s reservoir level. Different topologies and control conditions create different relationships.
Analog Devices’ AN-140 introduces linear and switching-regulator concepts and highlights the role of the control loop. The important point here is architectural: regulation involves more than the passive rectifier relationships implemented on this site.
If a user asks what DC voltage a complete adapter produces, the correct starting point is that adapter’s specified output and operating conditions, not a bridge formula applied to the incoming AC label. A rectifier model can help explain one internal concept without becoming a universal adapter-prediction tool.
Load changes have more than one consequence
In the site’s constant-current approximation, increasing load current increases estimated reservoir ripple in direct proportion. It also lowers the midpoint average and valley while leaving the assumed available top unchanged. Those are consequences of the chosen simplified equations.
An actual supply can also experience source-voltage changes, different diode drops, altered charging intervals, and regulator responses. These effects can interact rather than remain isolated. A regulator may maintain its output over some range and cease doing so outside the conditions for which it is specified.
This is why an unregulated output trend should not be transferred directly to a regulated output. The same load change can produce a visible reservoir change while the regulated rail behaves differently. Distinguish the nodes and use a model appropriate to each stage.
Read an adapter description carefully
A meaningful adapter assessment uses its documented output convention, voltage and current specifications, operating range, and applicable conditions. A nominal label alone cannot explain every transient, load, ripple, or temperature behavior.
Likewise, “regulated” is not a numerical specification by itself. It identifies a function, but a useful engineering statement needs limits and conditions. “Unregulated” does not mean a value can never be estimated; it means the voltage is not being held by the same kind of control function considered here.
For educational calculations, avoid inventing a particular adapter’s internal circuit. If its topology is unknown, say so. A clearly bounded bridge example is more useful than an apparently precise output number based on an unsupported assumption about the equipment.
Use the calculator at the correct boundary
The calculator is appropriate for comparing its defined rectifier models and understanding how the filtered estimate depends on RMS input, assumed diode drop, constant load current, frequency, and capacitance. It deliberately leaves regulation and equipment qualification outside that boundary.
Record a result as “estimated unregulated reservoir average, with estimated peak and valley” when that is what was calculated. If a downstream regulator is involved, assess it separately with the relevant manufacturer data and operating conditions. Do not silently rename the reservoir estimate as regulated output.
This division keeps the tool practical. It explains a useful part of AC to DC conversion, makes omissions visible, and tells the reader what additional information would be needed for the next question. A well-described partial model is stronger than a universal claim the inputs cannot support.
Keep a two-stage calculation readable
When a study includes both a reservoir and a regulator, record them as separate stages. The reservoir section can contain its assumed RMS source, diode drops, current, capacitance, average, and valley. The regulator section can then contain its intended output, relevant operating conditions, justified headroom requirement, and the manufacturer evidence used for any additional assessment.
This organization prevents an output target from being accidentally substituted for an input measurement. It also makes uncertainty visible: a reservoir average may be estimated while a regulator’s transient response remains unassessed. Unknown information should remain marked unknown instead of being filled with a familiar but unsupported default.
The same approach helps when discussing results with someone else. State “estimated reservoir valley” and “desired regulated output” in full at least once before abbreviating them. Two voltages can both be described as DC yet belong to different nodes and answer different questions. Clear names reduce the chance of a numerical comparison appearing more complete than the underlying model actually is.
Filed under power supply concepts rectifier basics